top of page
Formula 1 Wing Efficiency
Spring 2020
Modeled a research project to determine to efficiency of various F1 front wing design concepts. Project was unable to be executed due to COVID-19.
F1 Wing Efficiency: Welcome
Due to the nature of static wing design, the angle of attack of F1 wing blades is always a compromise between the straight track and curved track, depending on the portion of straight track and types of corner. The project was designed to identify whether adaptive wings could be a potential solution to this conflict. The project planned to investigate the aerodynamic efficiency of a currently employed F1 wings, and identify the limitations of the static wings by placing 3-D printed models in the wind tunnel test.
The research was divided into three stages: identifying the limitation of static wings, investigating the aerodynamic efficiency for different angle of attack, and experiment for testing flexible wings.
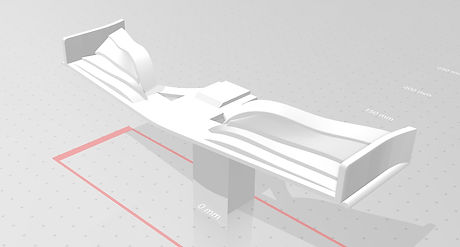
First, to identify the limitation of the static wing, a model of a currently employed front wing and rear wing would have been used in the experiment. The model would have been made by a 3-D printing machine and placed in the wind tunnel for testing. Due to the capacity and scale of the wind tunnel used in this experiment, the testing of life size wings was not feasible. Therefore, the calculation of dimensional analysis was made to accommodate both wind tunnel speed and 3-D printed model size to simulate the real racing speed.
The drag force and down force would have been measured by a strain gauge in the wind tunnel at speeds varying from the lowest to the top speeds in the Formula 1 racing. The forces would be measured by the strain gauge while the wing model is exposed in the wind tunnel.
To have a better insight into the limitation and the aerodynamic efficiency of the static wing model, the data acquired in the wind tunnel test would be plotted into Drag (N) vs Speed, Downforce (N) vs Speed, and Aerodynamic Ratio (Downforce / Drag) vs Speed Diagram. The diagrams would have offered a thorough illustration of how the static wings perform with different racing speed and the range of downforce or drag that static wings couldn’t provide at the corresponding speeds. That gap in the plot would set the limitation of static wings.
Second, in order to investigate the aerodynamic efficiency by varying angles of attack, the original wings model would have been modified into sets of wings with different attacking angles. The angle variation would be -3 degrees to +3 degrees from the original static wing setup. The modified wings would also have been made by a 3-D printer. Again, the models would be placed in the wind tunnel at various wind speeds to simulate real racing speeds. Data acquired would have been plotted into 3 graphs as the first stage was. By the end of this stage, each set of wings with different attacking angles should have 3 plots. All the plots with the same title then would have been compiled together along with the plots for original setup. The final plots would have been a good illustration of the capacity of the wings at various racing speeds. They would give a range of downforce, drag force, and aerodynamic ratio that both front and rear wing could generate at various speeds. This would have been a good reference to determine the durability of adaptive wings and for future design.
Third, in order to test the performance of flexible wings, it is necessary to identify its mechanism first[1] and identity the material will be used for 3-D printing.
F1 Wing Efficiency: Text
bottom of page